General Management
Introduction
Validator performance is pivotal in maintaining the security and stability of the Polkadot network. As a validator, optimizing your setup ensures efficient transaction processing, minimizes latency, and maintains system reliability during high-demand periods. Proper configuration and proactive monitoring also help mitigate risks like slashing and service interruptions.
This guide covers essential practices for managing a validator, including performance tuning techniques, security hardening, and tools for real-time monitoring. Whether you're fine-tuning CPU settings, configuring NUMA balancing, or setting up a robust alert system, these steps will help you build a resilient and efficient validator operation.
Configuration Optimization
For those seeking to optimize their validator's performance, the following configurations can improve responsiveness, reduce latency, and ensure consistent performance during high-demand periods.
Deactivate Simultaneous Multithreading
Polkadot validators operate primarily in single-threaded mode for critical tasks, so optimizing single-core CPU performance can reduce latency and improve stability. Deactivating simultaneous multithreading (SMT) can prevent virtual cores from affecting performance. SMT is called Hyper-Threading on Intel and 2-way SMT on AMD Zen.
Take the following steps to deactivate every other (vCPU) core:
-
Loop though all the CPU cores and deactivate the virtual cores associated with them:
-
To permanently save the changes, add
nosmt=forceto theGRUB_CMDLINE_LINUX_DEFAULTvariable in/etc/default/grub: -
Update GRUB to apply changes:
-
After the reboot, you should see that half of the cores are offline. To confirm, run:
Deactivate Automatic NUMA Balancing
Deactivating NUMA (Non-Uniform Memory Access) balancing for multi-CPU setups helps keep processes on the same CPU node, minimizing latency.
Follow these stpes:
-
Deactivate NUMA balancing in runtime:
-
Deactivate NUMA balancing permanently by adding
numa_balancing=disableto the GRUB settings: -
Update GRUB to apply changes:
-
Confirm the deactivation:
If you successfully deactivated NUMA balancing, the preceding command should return 0.
Spectre and Meltdown Mitigations
Spectre and Meltdown are well-known CPU vulnerabilities that exploit speculative execution to access sensitive data. These vulnerabilities have been patched in recent Linux kernels, but the mitigations can slightly impact performance, especially in high-throughput or containerized environments.
If your security requirements allow it, you can deactivate specific mitigations, such as Spectre V2 and Speculative Store Bypass Disable (SSBD), to improve performance.
To selectively deactivate the Spectre mitigations, take these steps:
-
Update the
GRUB_CMDLINE_LINUX_DEFAULTvariable in your/etc/default/grubconfiguration: -
Update GRUB to apply changes and then reboot:
This approach selectively deactivates the Spectre V2 and Spectre V4 mitigations, leaving other protections intact. For full security, keep mitigations activated unless there's a significant performance need, as disabling them could expose the system to potential attacks on affected CPUs.
Monitor Your Node
Monitoring your node's performance is critical for network reliability and security. Tools like the following provide valuable insights:
- Prometheus: An open-source monitoring toolkit for collecting and querying time-series data.
- Grafana: A visualization tool for real-time metrics, providing interactive dashboards.
- Alertmanager: A tool for managing and routing alerts based on Prometheus data.
This section covers setting up these tools and configuring alerts to notify you of potential issues.
Environment Setup
Before installing Prometheus, ensure the environment is set up securely by running Prometheus with restricted user privileges.
Follow these steps:
-
Create a Prometheus user to ensure Prometheus runs with minimal permissions:
-
Create directories for configuration and data storage:
-
Change directory ownership to ensure Prometheus has access:
Install and Configure Prometheus
After setting up the environment, install and configure the latest version of Prometheus as follows:
-
Download Prometheus for your system architecture from the releases page. Replace
INSERT_RELEASE_DOWNLOADwith the release binary URL (e.g.,https://github.com/prometheus/prometheus/releases/download/v3.0.0/prometheus-3.0.0.linux-amd64.tar.gz): -
Set up Prometheus:
-
Copy binaries:
-
Copy directories and assign ownership of these files to the
prometheususer: -
Clean up the download directory:
-
-
Create
prometheus.ymlto define global settings, rule files, and scrape targets:prometheus-config.ymlglobal: scrape_interval: 15s evaluation_interval: 15s rule_files: # - "first.rules" # - "second.rules" scrape_configs: - job_name: 'prometheus' scrape_interval: 5s static_configs: - targets: ['localhost:9090'] - job_name: 'substrate_node' scrape_interval: 5s static_configs: - targets: ['localhost:9615']Prometheus is scraped every 5 seconds in this example configuration file, ensuring detailed internal metrics. Node metrics with customizable intervals are scraped from port
9615by default. -
Verify the configuration with
promtool, an open source monitoring tool: -
Save the configuration and change the ownership of the file to
prometheususer:
Start Prometheus
-
Launch Prometheus with the appropriate configuration file, storage location, and necessary web resources, running it with restricted privileges for security:
sudo -u prometheus /usr/local/bin/prometheus --config.file /etc/prometheus/prometheus.yml \
--storage.tsdb.path /var/lib/prometheus/ \
--web.console.templates=/etc/prometheus/consoles \
--web.console.libraries=/etc/prometheus/console_libraries
If you set the server up properly, you should see terminal output similar to the following:
... ts=2024-11-10T17:59:23.056Z caller=main.go:627 level=info msg="No time or size retention was set so using the default time retention" duration=15d ts=2024-11-10T17:59:23.056Z caller=main.go:671 level=info msg="Starting Prometheus Server" mode=server version="(version=2.55.1, branch=HEAD, revision=6d7569113f1ca814f1e149f74176656540043b8d)" ts=2024-11-10T17:59:23.056Z caller=main.go:676 level=info build_context="(go=go1.23.2, platform=linux/amd64, user=root@194e0f5dd5e8, date=20241106-10:08:33, tags=netgo,builtinassets,stringlabels)" ts=2024-11-10T17:59:23.056Z caller=main.go:677 level=info host_details="(Linux 6.8.0-36-generic #36-Ubuntu SMP PREEMPT_DYNAMIC Mon Jun 10 10:49:14 UTC 2024 x86_64 ubuntu-s-2vcpu-4gb-amd-nyc3-01 (none))" ts=2024-11-10T17:59:23.056Z caller=main.go:678 level=info fd_limits="(soft=1048576, hard=1048576)" ts=2024-11-10T17:59:23.056Z caller=main.go:679 level=info vm_limits="(soft=unlimited, hard=unlimited)" ts=2024-11-10T17:59:23.064Z caller=web.go:585 level=info component=web msg="Start listening for connections" address=0.0.0.0:9090 ts=2024-11-10T17:59:23.065Z caller=main.go:1197 level=info msg="Starting TSDB ..." ts=2024-11-10T17:59:23.067Z caller=tls_config.go:348 level=info component=web msg="Listening on" address=[::]:9090 ... ts=2024-11-10T17:59:23.106Z caller=main.go:1221 level=info msg="TSDB started" ts=2024-11-10T17:59:23.106Z caller=main.go:1404 level=info msg="Loading configuration file" filename=/etc/prometheus/prometheus.yml ts=2024-11-10T17:59:23.107Z caller=main.go:1441 level=info msg="updated GOGC" old=100 new=75 ts=2024-11-10T17:59:23.108Z caller=main.go:1452 level=info msg="Completed loading of configuration file" filename=/etc/prometheus/prometheus.yml totalDuration=1.878152ms db_storage=2.184µs remote_storage=2.966µs web_handler=822ns query_engine=1.823µs scrape=628.272µs scrape_sd=93.581µs notify=1.774µs notify_sd=1.413µs rules=2.735µs tracing=10.48µs ts=2024-11-10T17:59:23.108Z caller=main.go:1182 level=info msg="Server is ready to receive web requests." ts=2024-11-10T17:59:23.108Z caller=manager.go:164 level=info component="rule manager" msg="Starting rule manager..." -
Verify you can access the Prometheus interface by navigating to:
If the interface appears to work as expected, exit the process using
Control + C. -
Create a systemd service file to ensure Prometheus starts on boot:
prometheus.service[Unit] Description=Prometheus Monitoring Wants=network-online.target After=network-online.target [Service] User=prometheus Group=prometheus Type=simple ExecStart=/usr/local/bin/prometheus \ --config.file /etc/prometheus/prometheus.yml \ --storage.tsdb.path /var/lib/prometheus/ \ --web.console.templates=/etc/prometheus/consoles \ --web.console.libraries=/etc/prometheus/console_libraries ExecReload=/bin/kill -HUP $MAINPID [Install] WantedBy=multi-user.target -
Reload systemd and enable the service to start on boot:
-
Verify the service is running by visiting the Prometheus interface again at:
Install and Configure Grafana
This guide follows Grafana's canonical installation instructions.
To install and configure Grafana, follow these steps:
-
Install Grafana prerequisites:
-
Import the GPG key:
-
Configure the stable release repo and update packages:
-
Install the latest stable version of Grafana:
To configure Grafana, take these steps:
-
Configure Grafana to start automatically on boot and start the service:
-
Check if Grafana is running:
If necessary, you can stop or restart the service with the following commands:
-
Access Grafana by navigating to the following URL and logging in with the default username and password (
admin):
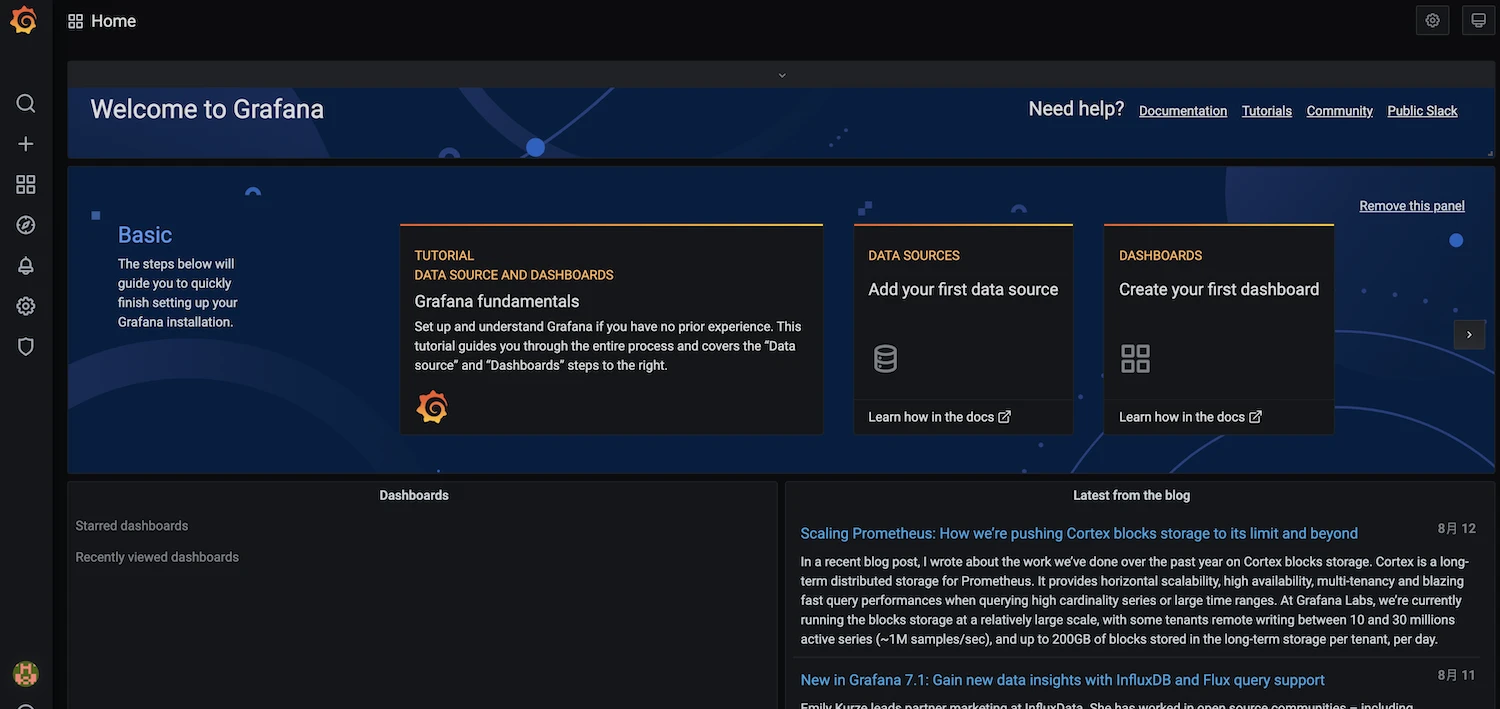
To visualize node metrics, follow these steps:
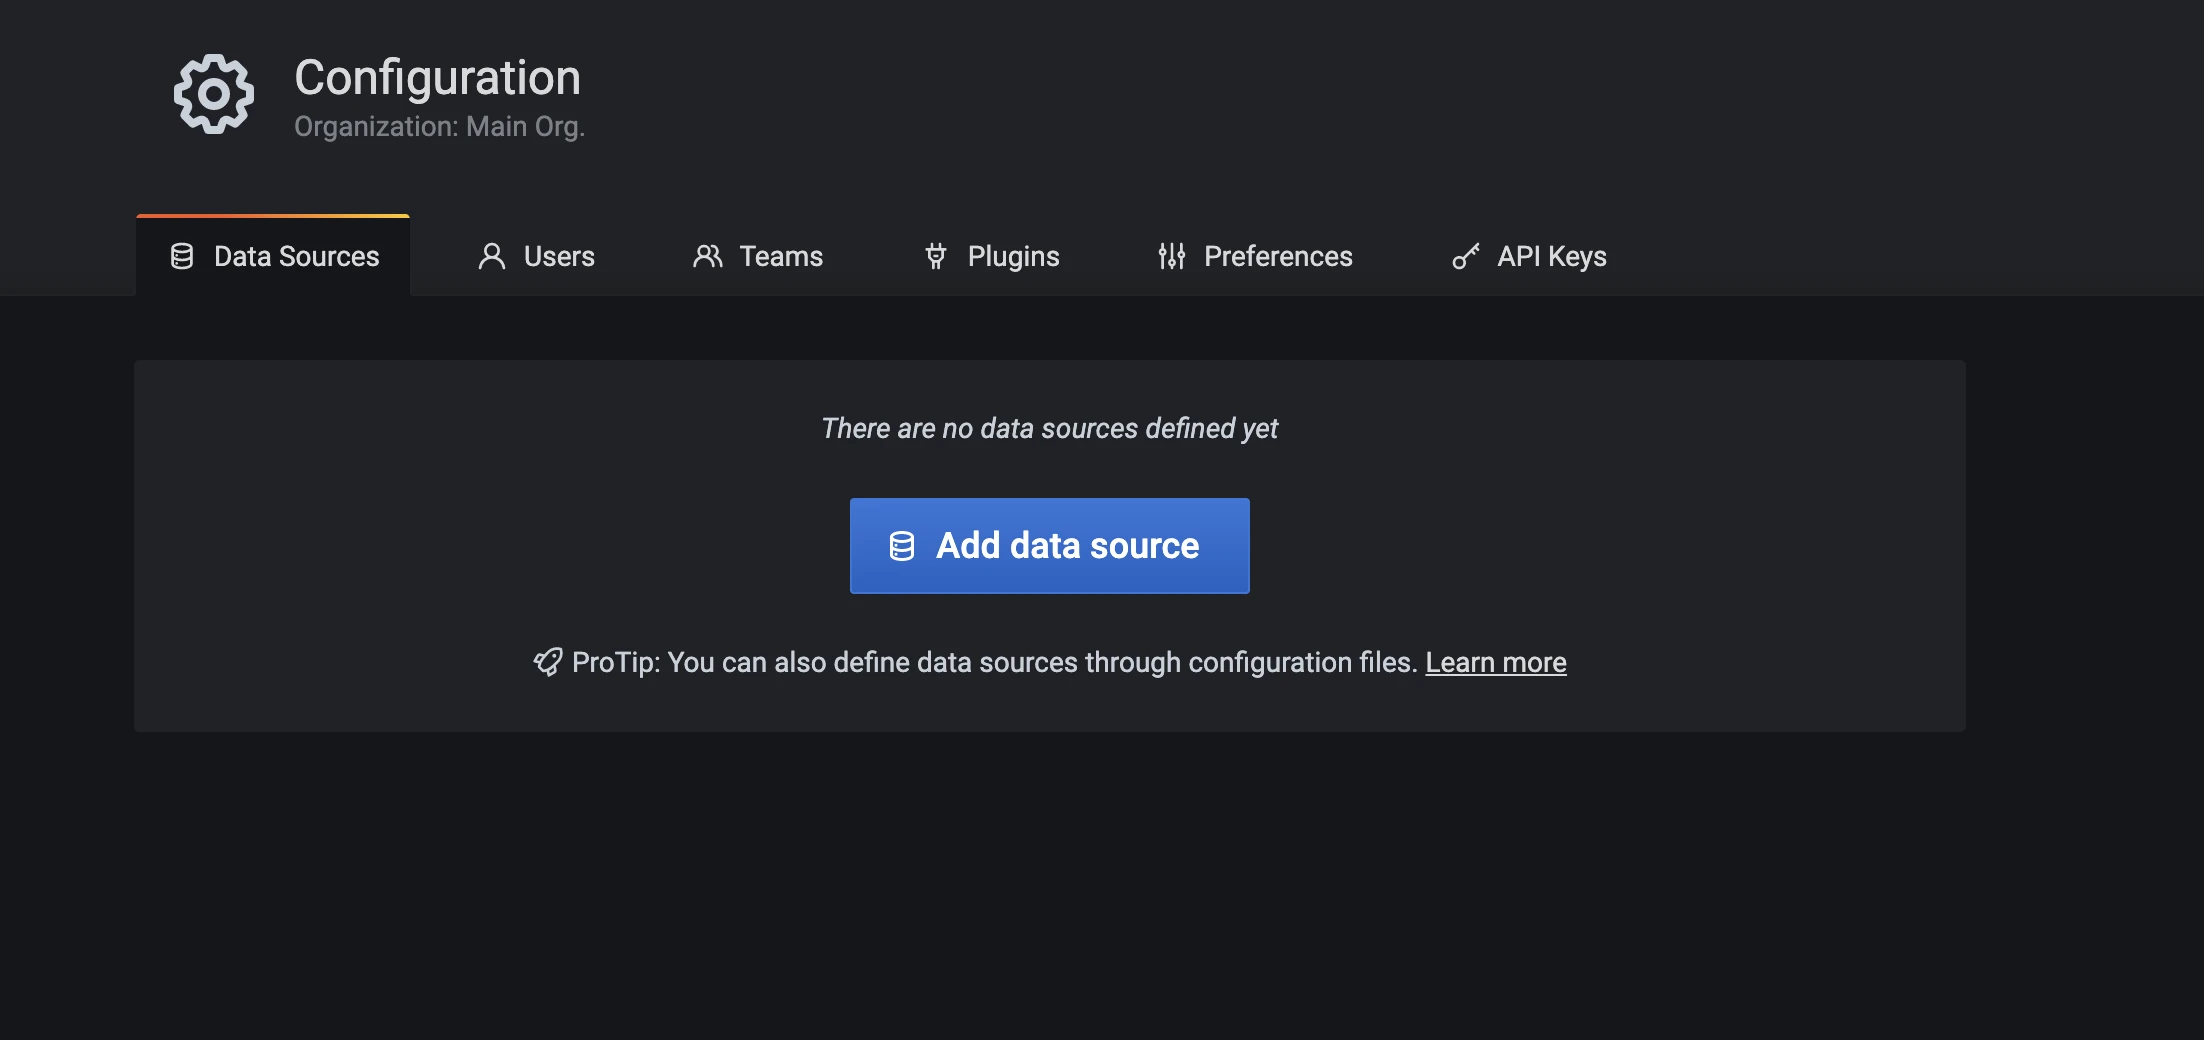
- Select the gear icon to access Data Sources settings.
-
Select Add data source to define the data source.
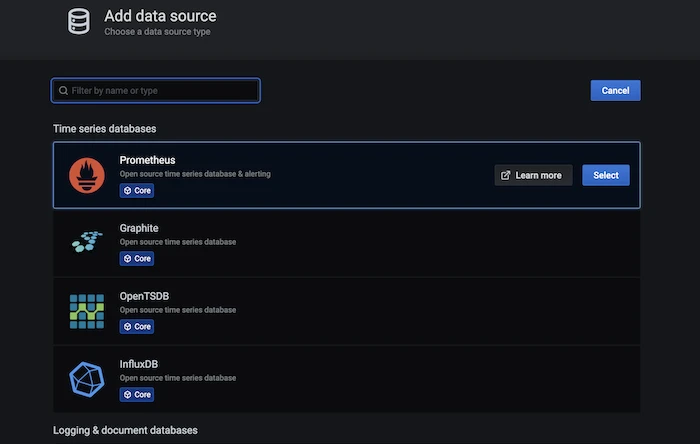
-
Select Prometheus.
-
Enter
http://localhost:9090in the URL field and click Save & Test. If "Data source is working" appears, your connection is configured correctly.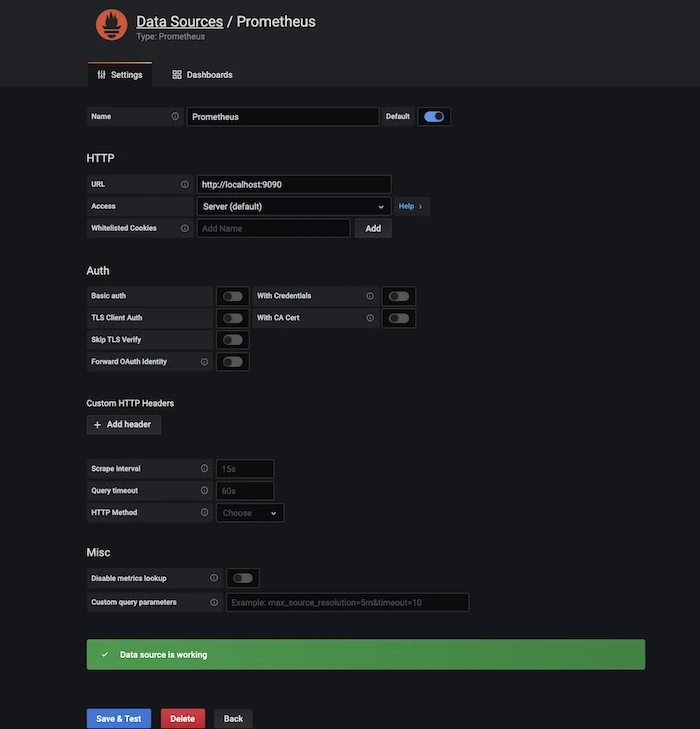
-
Select Import from the left menu, choose Prometheus from the dropdown, and click Import.
-
Start your Polkadot node by running
./polkadot. You should now be able to monitor node performance, block height, network traffic, and tasks tasks on the Grafana dashboard.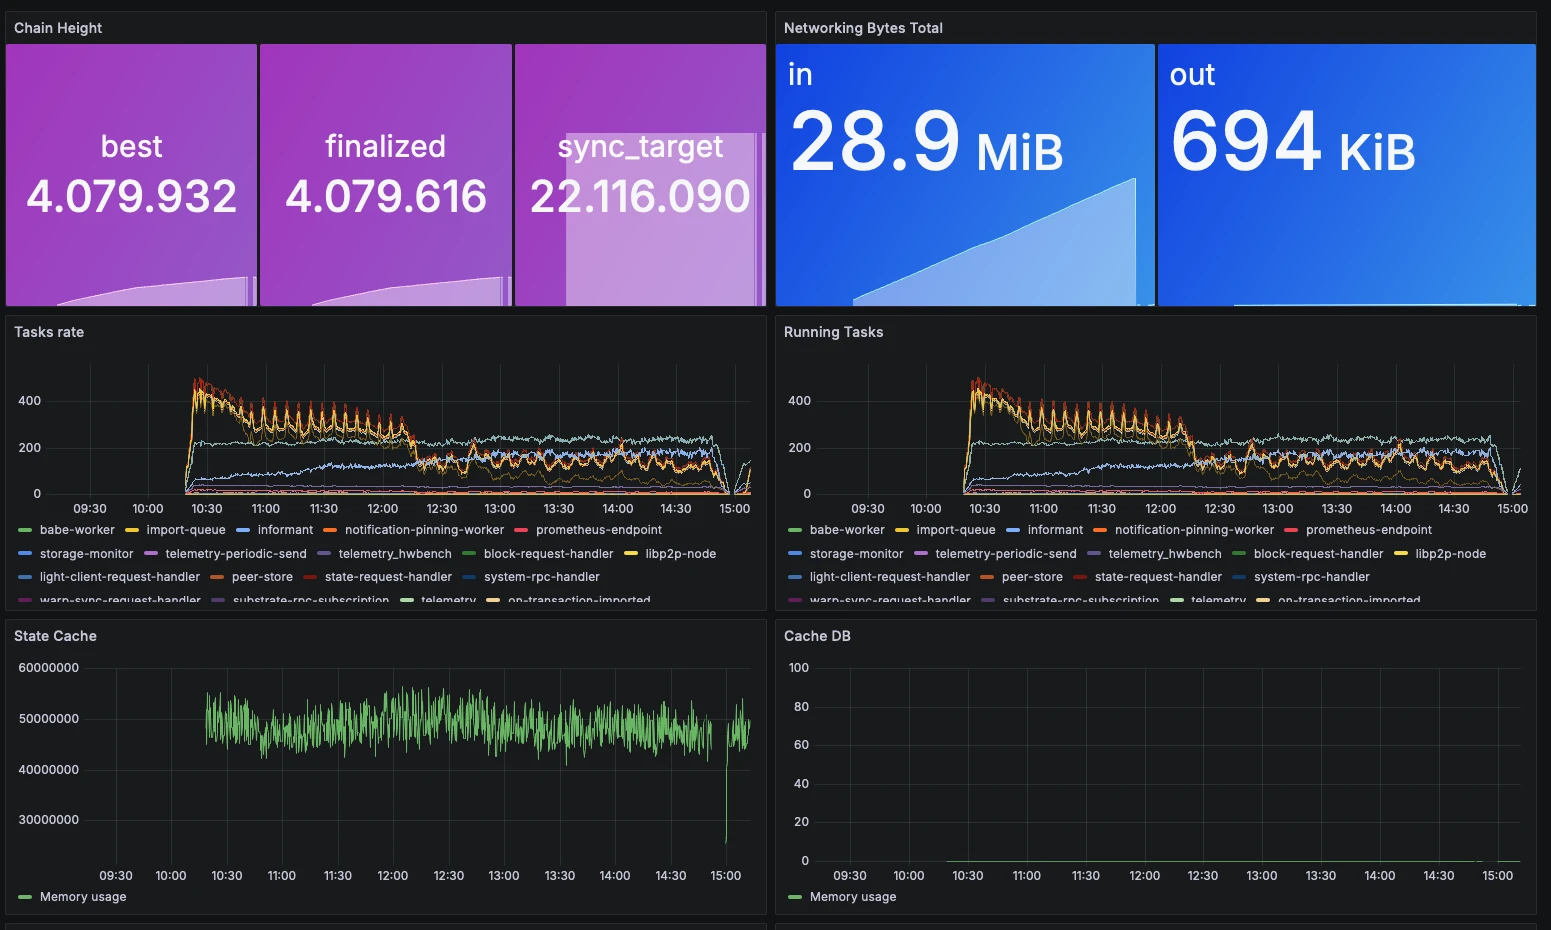
The Grafana dashboards page features user created dashboards made available for public use. For an example, see the Substrate Node Metrics dashboard.
Install and Configure Alertmanager
Alertmanager is an optional component that complements Prometheus by managing alerts and notifying users about potential issues.
Follow these steps to install and configure Alertmanager:
-
Download Alertmanager for your system architecture from the releases page. Replace
INSERT_RELEASE_DOWNLOADwith the release binary URL (e.g.,https://github.com/prometheus/alertmanager/releases/download/v0.28.0-rc.0/alertmanager-0.28.0-rc.0.linux-amd64.tar.gz): -
Copy the binaries to the system directory and set permissions:
-
Create the
alertmanager.ymlconfiguration file under/etc/alertmanager:Generate an app password in your Google account to enable email notifications from Alertmanager. Then, add the following code to the configuration file to define email notifications using your email and app password:
alertmanager.ymlglobal: resolve_timeout: 1m route: receiver: 'gmail-notifications' receivers: - name: 'gmail-notifications' email_configs: - to: INSERT_YOUR_EMAIL from: INSERT_YOUR_EMAIL smarthost: smtp.gmail.com:587 auth_username: INSERT_YOUR_EMAIL auth_identity: INSERT_YOUR_EMAIL auth_password: INSERT_YOUR_APP_PASSWORD send_resolved: true -
Configure Alertmanager as a service by creating a systemd service file:
alertmanager.service[Unit] Description=AlertManager Server Service Wants=network-online.target After=network-online.target [Service] User=root Group=root Type=simple ExecStart=/usr/local/bin/alertmanager --config.file /etc/alertmanager/alertmanager.yml --web.external-url=http://SERVER_IP:9093 --cluster.advertise-address='0.0.0.0:9093' [Install] WantedBy=multi-user.target -
Reload and enable the service:
-
Verify the service status:
If you have configured Alertmanager properly, the Active field should display active (running) similar to below:
sudo systemctl status alertmanager alertmanager.service - AlertManager Server Service Loaded: loaded (/etc/systemd/system/alertmanager.service; enabled; vendor preset: enabled) Active: active (running) since Thu 2020-08-20 22:01:21 CEST; 3 days ago Main PID: 20592 (alertmanager) Tasks: 70 (limit: 9830) CGroup: /system.slice/alertmanager.service
Grafana Plugin
There is an Alertmanager plugin in Grafana that can help you monitor alert information.
Follow these steps to use the plugin:
-
Install the plugin:
-
Restart Grafana:
-
Configure Alertmanager as a data source in your Grafana dashboard (
SERVER_IP:3000):- Go to Configuration > Data Sources and search for Prometheus Alertmanager.
- Enter the server URL and port for the Alertmanager service, and select Save & Test to verify the connection.
-
Import the 8010 dashboard for Alertmanager, selecting Prometheus Alertmanager in the last column, then select Import.
Integrate Alertmanager
Complete the integration by following these steps to enable communication between Prometheus and Alertmanager and configure detection and alert rules:
-
Update the
etc/prometheus/prometheus.ymlconfiguration file to include the following code:prometheus.ymlrule_files: - 'rules.yml' alerting: alertmanagers: - static_configs: - targets: - localhost:9093Expand the following item to view the complete
prometheus.ymlfile.prometheus.yml
prometheus.ymlglobal: scrape_interval: 15s evaluation_interval: 15s rule_files: - 'rules.yml' alerting: alertmanagers: - static_configs: - targets: - localhost:9093 scrape_configs: - job_name: 'prometheus' scrape_interval: 5s static_configs: - targets: ['localhost:9090'] - job_name: 'substrate_node' scrape_interval: 5s static_configs: - targets: ['localhost:9615'] -
Create the rules file for detection and alerts:
Add a sample rule to trigger email notifications for node downtime over five minutes:
rules.ymlgroups: - name: alert_rules rules: - alert: InstanceDown expr: up == 0 for: 5m labels: severity: critical annotations: summary: 'Instance [{{ $labels.instance }}] down' description: '[{{ $labels.instance }}] of job [{{ $labels.job }}] has been down for more than 5 minutes.'If any of the conditions defined in the rules file are met, an alert will be triggered. For more on alert rules, refer to Alerting Rules and additional alerts.
-
Update the file ownership to
prometheus: -
Validate the rules syntax:
-
Restart Prometheus and Alertmanager:
Now you will receive an email alert if one of your rule triggering conditions is met.
Secure Your Validator
Validators in Polkadot's Proof of Stake (PoS) network play a critical role in maintaining network integrity and security by keeping the network in consensus and verifying state transitions. To ensure optimal performance and minimize risks, validators must adhere to strict guidelines around security and reliable operations.
Key Management
Though they don't transfer funds, session keys are essential for validators as they sign messages related to consensus and parachains. Securing session keys is crucial as allowing them to be exploited or used across multiple nodes can lead to a loss of staked funds via slashing.
Given the current limitations in high-availability setups and the risks associated with double-signing, it’s recommended to run only a single validator instance. Keys should be securely managed, and processes automated to minimize human error.
There are two approaches for generating session keys:
-
Generate and store in node: Using the
author.rotateKeysRPC call. For most users, generating keys directly within the client is recommended. You must submit a session certificate from your staking proxy to register new keys. See the How to Validate guide for instructions on setting keys. -
Generate outside node and insert: Using the
author.setKeysRPC call. This flexibility accommodates advanced security setups and should only be used by experienced validator operators.
Signing Outside the Client
Polkadot plans to support external signing, allowing session keys to reside in secure environments like Hardware Security Modules (HSMs). However, these modules can sign any payload they receive, potentially enabling an attacker to perform slashable actions.
Secure-Validator Mode
Polkadot's Secure-Validator mode offers an extra layer of protection through strict filesystem, networking, and process sandboxing. This secure mode is activated by default if the machine meets the following requirements:
- Linux (x86-64 architecture): Usually Intel or AMD.
-
Enabled
seccomp: This kernel feature facilitates a more secure approach for process management on Linux. Verify by running.If
seccompis enabled, you should see output similar to the following:
Tip
Optionally, Linux 5.13 may also be used, as it provides access to even more strict filesystem protections.
Linux Best Practices
Follow these best practices to keep your validator secure:
- Use a non-root user for all operations.
- Regularly apply OS security patches.
- Enable and configure a firewall.
- Use key-based SSH authentication; deactivate password-based login.
- Regularly back up data and harden your SSH configuration. Visit this SSH guide for more details.
Validator Best Practices
Additional best practices can add an additional layer of security and operational reliability:
- Only run the Polkadot binary, and only listen on the configured p2p port.
- Run on bare-metal machines, as opposed to virtual machines.
- Provisioning of the validator machine should be automated and defined in code which is kept in private version control, reviewed, audited, and tested.
- Generate and provide session keys in a secure way.
- Start Polkadot at boot and restart if stopped for any reason.
- Run Polkadot as a non-root user.
- Establish and maintain an on-call rotation for managing alerts.
- Establish and maintain a clear protocol with actions to perform for each level of each alert with an escalation policy.
Additional Resources
- Certus One's Knowledge Base
- EOS Block Producer Security List
- HSM Policies and the Importance of Validator Security
For additional guidance, connect with other validators and the Polkadot engineering team in the Polkadot Validator Lounge on Element.
| Created: October 16, 2024